
What Is a Good Reaction Time? Benchmarks by Age & Activity
What Is a Good Reaction Time? Benchmarks by Age, Activity & Test Type
"Is my reaction time good?" It's one of the most common questions people ask after taking a reaction time test. But the answer depends on context — your age, what you're comparing against, and which test you used all matter.
This article provides clear benchmarks for reaction time across different populations, explains what the numbers actually mean, and helps you understand where you stand.
Quick Answer: Reaction Time Benchmarks
For a simple visual reaction time test (click when you see a stimulus) in healthy adults aged 18–35:
- Exceptional (<170ms): Top 5%. Competitive gamers, trained athletes, or very well-rested individuals
- Fast (170–200ms): Above average. You have quick reflexes and good alertness
- Average (200–250ms): Normal range for most healthy adults
- Below average (250–300ms): Still within normal range, but may indicate fatigue, distraction, or suboptimal conditions
- Slow (>300ms): Worth investigating — could be caused by sleep deprivation, medication, or other factors
These numbers are for simple reaction time (one stimulus, one response). Choice reaction time (multiple stimuli, multiple responses) is typically 50–100ms slower.
Find out your reaction time
Take CortexLab's free PVT test for accurate measurement
Reaction Time by Age

Reaction time follows a predictable curve across the lifespan. Based on research data:
Children & Adolescents
- Ages 5–9: 300–400ms. The nervous system is still developing
- Ages 10–14: 250–300ms. Rapid improvement as myelination increases
- Ages 15–19: 200–250ms. Approaching adult levels
Adults
- Ages 20–29: 190–220ms. Peak reaction time period
- Ages 30–39: 200–240ms. Slight decline begins, often unnoticeable
- Ages 40–49: 210–260ms. Gradual slowing, compensated by experience
- Ages 50–59: 230–280ms. More noticeable decline in speed
- Ages 60+: 250–350ms+. Significant slowing, though highly variable between individuals
These are population averages. Individual variation is large — a fit, well-rested 50-year-old can easily outperform a sleep-deprived 25-year-old. For more detail, see our article on average reaction time by age.
Reaction Time by Activity
Competitive Gaming / Esports
- Professional FPS players: 140–170ms consistently
- Top amateur gamers: 160–190ms
- Casual gamers: 180–220ms
Gamers tend to have faster reaction times than non-gamers, though the relationship between gaming and reaction speed is bidirectional — both selection effects and training effects are at play.
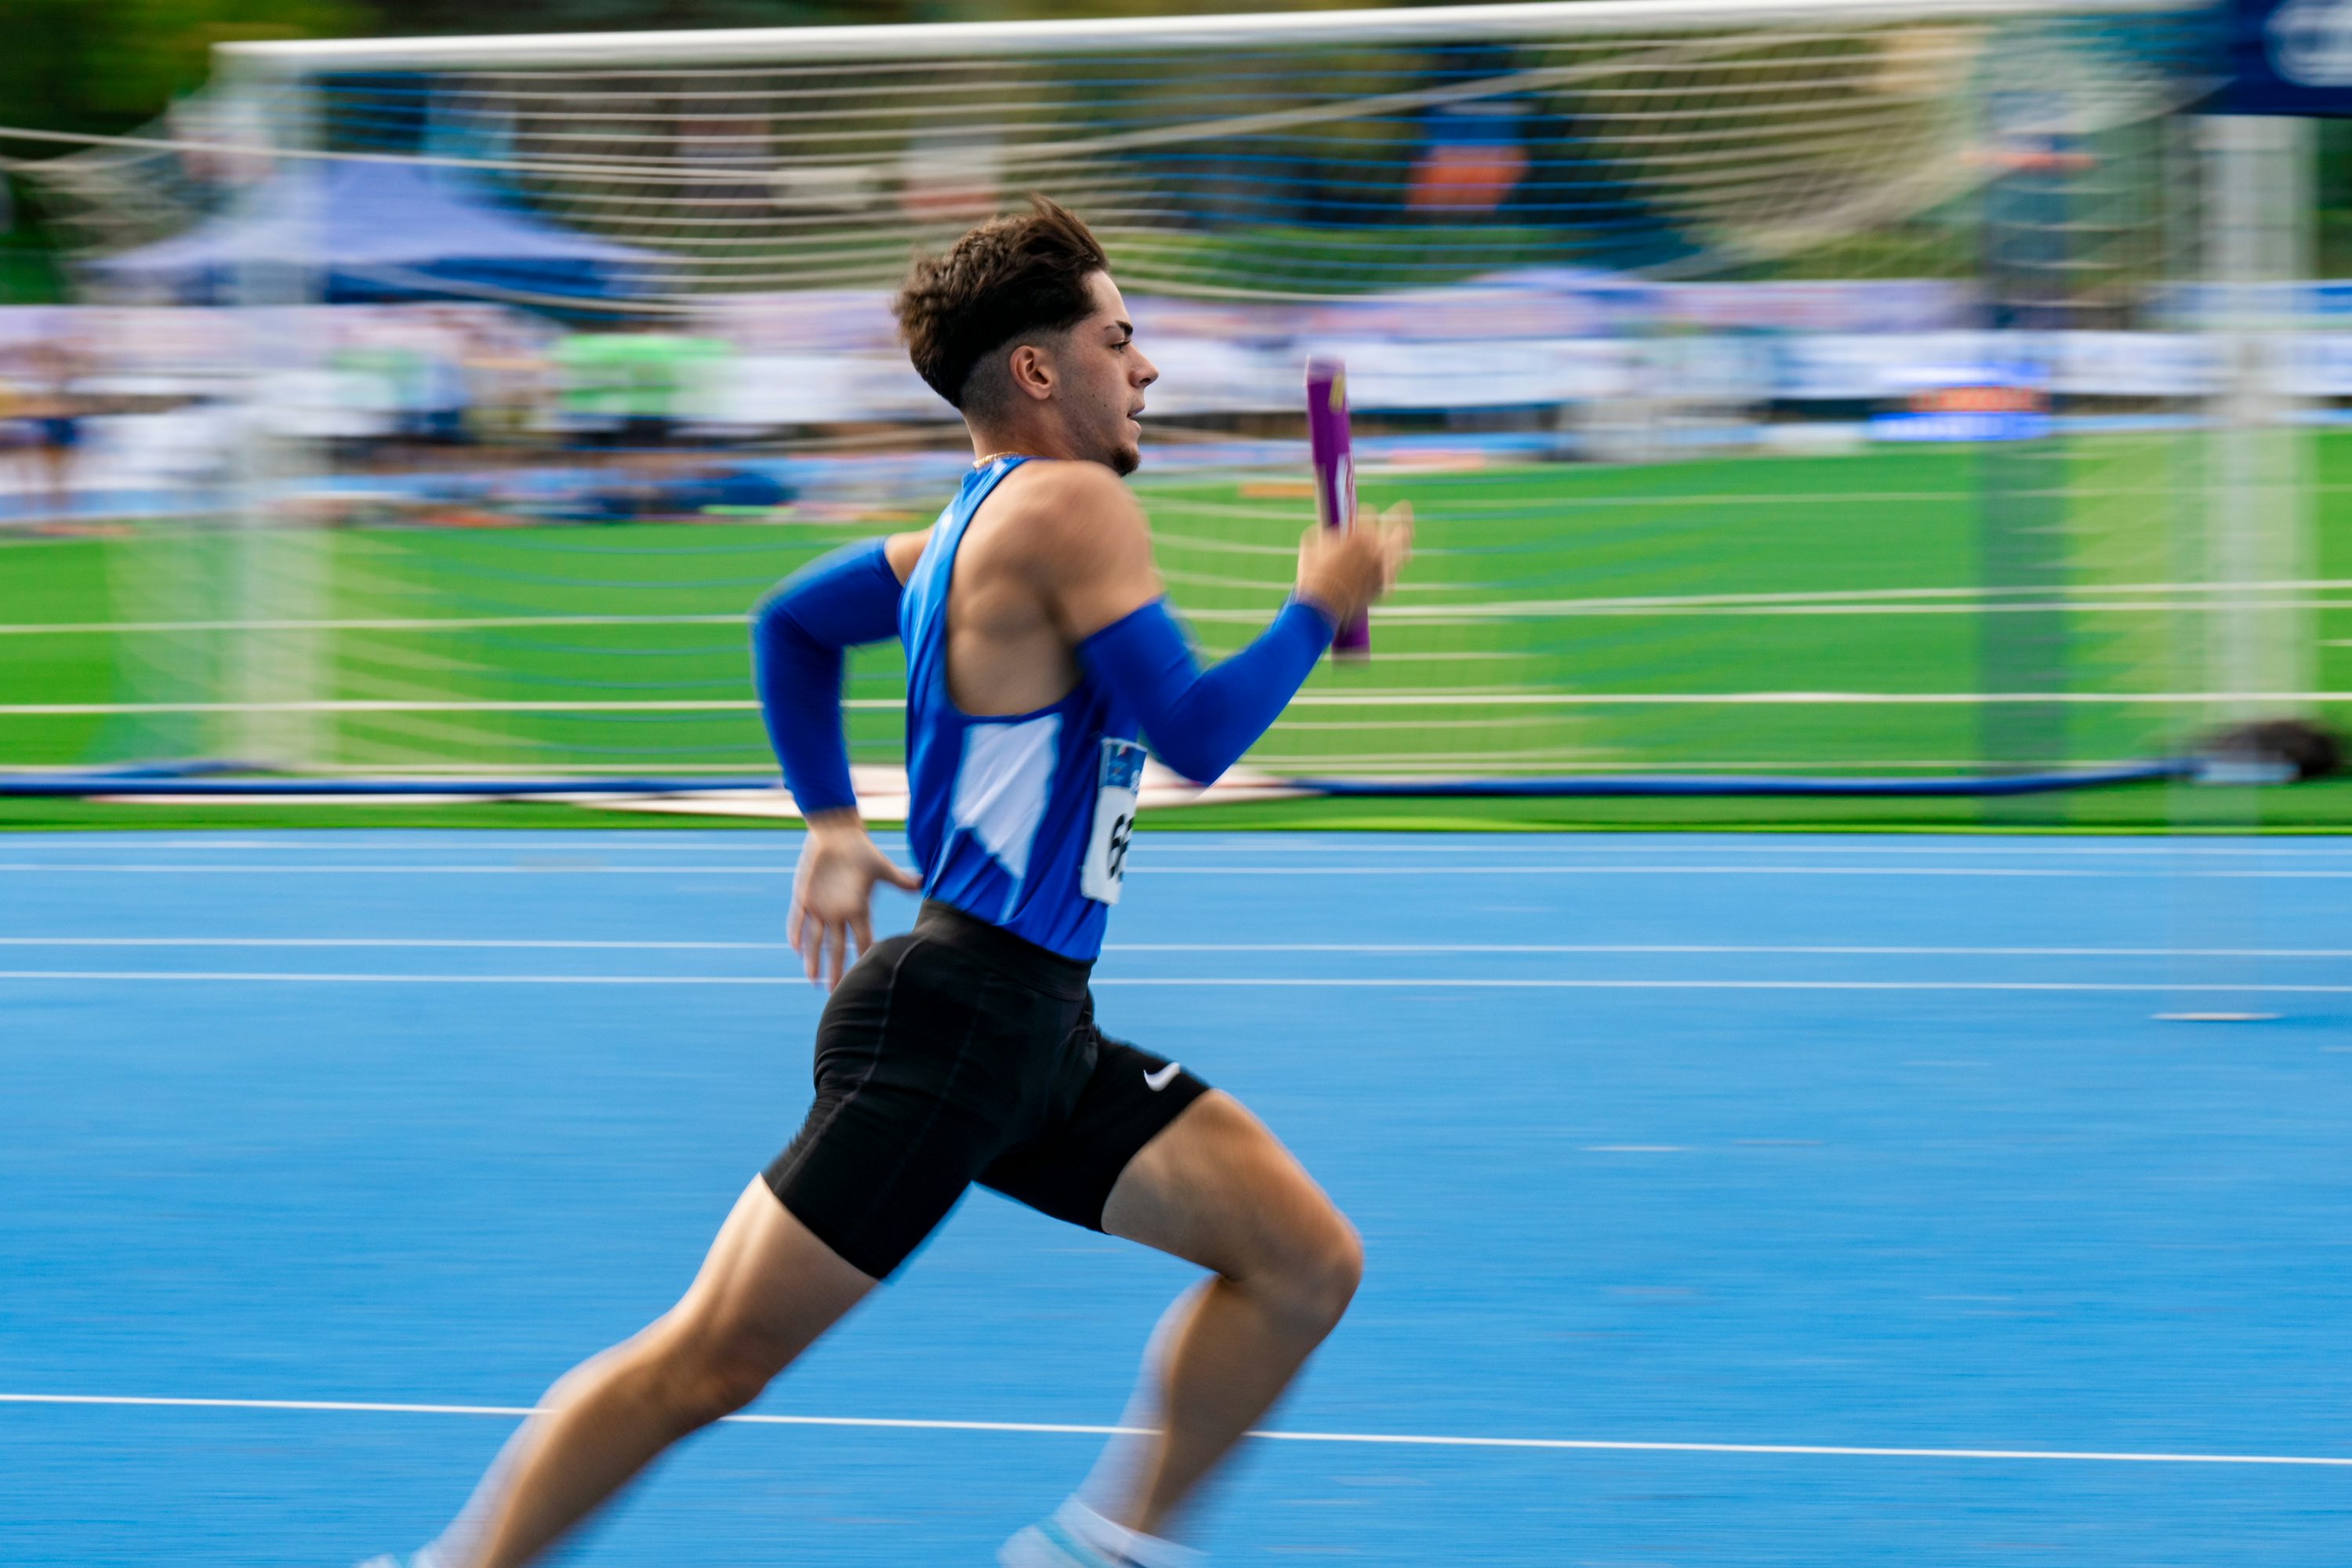
Sports
- Sprint starts: Athletes react to the starting gun in 120–160ms. Under 100ms is considered a false start (the IAAF threshold)
- Baseball batters: Must decide to swing within ~150ms of a fastball release
- Boxing/MMA: Reaction to opponent movements: 150–200ms
- Tennis return: 160–200ms to read and react to a serve
Driving
- Expected events (traffic light change): 200–300ms
- Unexpected events (child running into road): 700–1500ms. This includes recognition time, not just raw reaction
- This is why following distance matters — raw reaction time is only part of total stopping time
What Makes a Reaction Time Test "Good"?
Not all reaction time tests are equal. The quality of your measurement depends on the test methodology.
Single-Click Tests (e.g., "Click When the Screen Changes Color")
- Pros: Quick, fun, easy to share results
- Cons: Only 3–5 trials, heavily influenced by anticipation. One lucky guess can skew your "average" by 50ms
- Reliability: Low. Your score might vary by 30–50ms between sessions
PVT (Psychomotor Vigilance Test)
- Pros: 3+ minutes, dozens of trials, random intervals prevent anticipation. Reports median, fastest 10%, and lapse count
- Cons: Takes longer than a quick click test
- Reliability: High. Clinically validated, used by NASA, military, and sleep researchers
CortexLab's Approach
CortexLab uses the PVT methodology for maximum accuracy. Three metrics give you a complete picture:
- Median reaction time: Your typical speed (more robust than average, which is skewed by outliers)
- Fastest 10%: Your peak capability when fully engaged
- Lapse count: Responses over 500ms — the number of attention lapses during the test
Factors That Affect Your Score
Before comparing your reaction time to benchmarks, consider these factors:
Test Conditions
- Device: Touchscreen devices add 30–70ms of input lag compared to a mouse click. Phone screens add more latency than desktop monitors
- Display lag: 60Hz monitors add up to 16.7ms vs 144Hz+ gaming monitors
- Browser: Different browsers have slightly different timing accuracy
Your State
- Sleep: 6 hours of sleep vs 8 hours can mean a 20–40ms difference
- Caffeine: 100–200mg improves reaction time by 10–20ms
- Time of day: Most people are fastest between 10am and 2pm
- Alcohol: Even small amounts measurably slow reaction time
- Fatigue: Mental fatigue from a long workday degrades reaction speed
How to Improve Your Reaction Time

If your reaction time isn't where you want it, here's what actually works:
- Sleep optimization: The single biggest lever. Going from 6 to 8 hours can improve your time by 15–25%
- Regular testing: Daily PVT practice (3 minutes) builds the stimulus-response pathway
- Exercise: Aerobic exercise increases cerebral blood flow and dopamine, both of which speed up processing
- Caffeine: Used strategically (not chronically), caffeine provides a reliable 10–20ms boost
For a complete guide, see how to improve reaction time.
Stop Comparing, Start Tracking
The most useful comparison isn't your time vs. someone else's — it's your time today vs. your time last week. Population benchmarks help you understand the general range, but personal tracking reveals what actually matters:
- How does sleep affect your reaction time?
- Does exercise before testing make a difference for you?
- Are you improving, stable, or declining over time?
CortexLab's condition logging and trend charts let you answer these questions with data, not guesswork.
A "good" reaction time is context-dependent: 200ms is excellent for a 50-year-old and average for a 25-year-old gamer. Rather than fixating on a single number, use CortexLab's free PVT test to establish your personal baseline and track how sleep, exercise, and other factors influence your performance over time. Your reaction time is not a fixed trait — it's a dynamic measure that responds to how you live.
Share this article
Michelle Liu
Developer & Cognitive Performance Researcher at CortexLab
Software engineer bridging cognitive science and technology. Focused on building scientifically-grounded brain performance measurement tools.

![Reaction Time Test: How Fast Are You? [Free Online Test]](/_next/image?url=%2Fimages%2Fblog%2Freaction-time-test%2Fthumbnail.webp&w=3840&q=75)

